VWAP Momentum Trade
- This sample is based on:
from pyalgotrade import strategy
from pyalgotrade.barfeed import yahoofeed
from pyalgotrade import plotter
from pyalgotrade.tools import yahoofinance
from pyalgotrade.technical import vwap

import os

class MyStrategy(strategy.Strategy):
	def __init__(self, feed, instrument, vwapWindowSize):
		strategy.Strategy.__init__(self, feed)
		self.__instrument = instrument
		self.__vwap = vwap.VWAP(feed[instrument], vwapWindowSize)

	def getVWAPDS(self):
		return self.__vwap

	def onBars(self, bars):
		vwap = self.__vwap[-1]
		if vwap == None:
			return

		shares = self.getBroker().getShares(self.__instrument)
		price = bars[self.__instrument].getClose()
		notional = shares * price
		if price < vwap * 0.995 and notional > 0:
			self.order(self.__instrument, -100)
		elif price > vwap * 1.005 and notional < 1000000:
			self.order(self.__instrument, 100)

def build_feed(instruments, fromYear, toYear):
	feed = yahoofeed.Feed()

	for year in range(fromYear, toYear+1):
		for symbol in instruments:
			fileName = "%s-%d-yahoofinance.csv" % (symbol, year)
			if not os.path.exists(fileName):
				print "Downloading %s %d" % (symbol, year)
				csv = yahoofinance.get_daily_csv(symbol, year)
				f = open(fileName, "w")
				f.write(csv)
				f.close()
			feed.addBarsFromCSV(symbol, fileName)
	return feed

def main(plot):
	instrument = "aapl"
	vwapWindowSize = 5

	# Download the bars.
	feed = build_feed([instrument], 2011, 2012)

	myStrategy = MyStrategy(feed, instrument, vwapWindowSize)

	if plot:
		plt = plotter.StrategyPlotter(myStrategy, True, False, True)
		plt.getInstrumentSubplot(instrument).addDataSeries("vwap", myStrategy.getVWAPDS())

	myStrategy.run()
	print "Result: %.2f" % myStrategy.getResult()

	if plot:
		plt.plot()

if __name__ == "__main__":
	main(True)
this is what the output should look like:
Downloading aapl 2011
Downloading aapl 2012
Result: 1436098.00
and this is what the plot should look like:
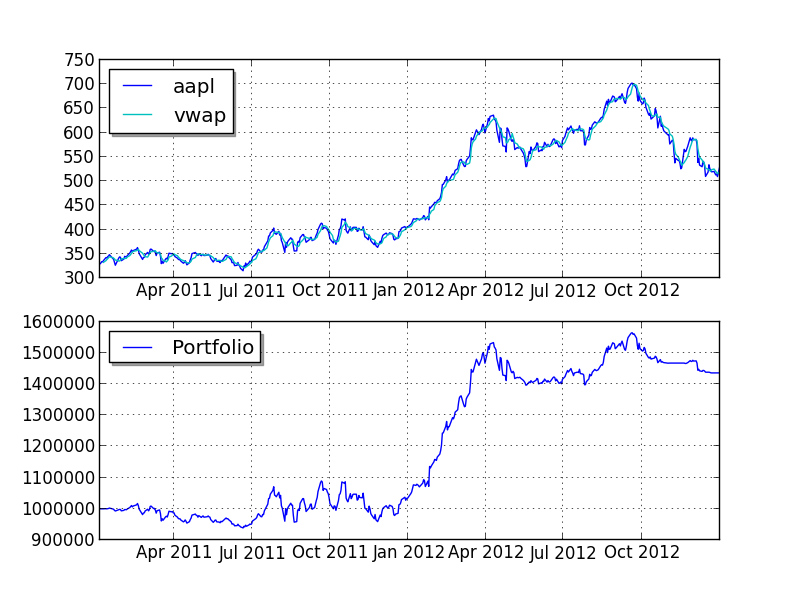
you can get better returns by tunning the VWAP period as well as the entry and exit points.