Ernie Chan’s Gold vs. Gold Miners
- This sample is based on:
from pyalgotrade import strategy
from pyalgotrade import dataseries
from pyalgotrade.dataseries import aligned
from pyalgotrade import plotter
from pyalgotrade.tools import yahoofinance

import numpy as np
import statsmodels.api as sm

def get_beta(values1, values2):
    # http://statsmodels.sourceforge.net/stable/regression.html
    model = sm.OLS(values1, values2)
    results = model.fit()
    return results.params[0]

class StatArbHelper:
    def __init__(self, ds1, ds2, windowSize):
        # We're going to use datetime aligned versions of the dataseries.
        self.__ds1, self.__ds2 = aligned.datetime_aligned(ds1, ds2)
        self.__windowSize = windowSize
        self.__hedgeRatio = None
        self.__spread = None
        self.__spreadMean = None
        self.__spreadStd = None
        self.__zScore = None

    def getSpread(self):
        return self.__spread

    def getSpreadMean(self):
        return self.__spreadMean

    def getSpreadStd(self):
        return self.__spreadStd

    def getZScore(self):
        return self.__zScore

    def getHedgeRatio(self):
        return self.__hedgeRatio

    def __updateHedgeRatio(self, values1, values2):
        self.__hedgeRatio = get_beta(values1, values2)

    def __updateSpreadMeanAndStd(self, values1, values2):
        if self.__hedgeRatio != None:
            spread = values1 - values2 * self.__hedgeRatio
            self.__spreadMean = spread.mean()
            self.__spreadStd = spread.std(ddof=1)

    def __updateSpread(self):
        if self.__hedgeRatio != None:
            self.__spread = self.__ds1[-1] - self.__hedgeRatio * self.__ds2[-1]

    def __updateZScore(self):
        if  self.__spread != None and self.__spreadMean != None and self.__spreadStd != None:
            self.__zScore = (self.__spread - self.__spreadMean) / float(self.__spreadStd)

    def update(self):
        if len(self.__ds1) >= self.__windowSize:
            values1 = np.array(self.__ds1[-1*self.__windowSize:])
            values2 = np.array(self.__ds2[-1*self.__windowSize:])
            self.__updateHedgeRatio(values1, values2)
            self.__updateSpread()
            self.__updateSpreadMeanAndStd(values1, values2)
            self.__updateZScore()

class MyStrategy(strategy.BacktestingStrategy):
    def __init__(self, feed, instrument1, instrument2, windowSize):
        strategy.BacktestingStrategy.__init__(self, feed)
        self.getBroker().setUseAdjustedValues(True)
        self.__statArbHelper = StatArbHelper(feed[instrument1].getAdjCloseDataSeries(), feed[instrument2].getAdjCloseDataSeries(), windowSize)
        self.__i1 = instrument1
        self.__i2 = instrument2

        # These are used only for plotting purposes.
        self.__spread = dataseries.SequenceDataSeries()
        self.__hedgeRatio = dataseries.SequenceDataSeries()

    def getSpreadDS(self):
        return self.__spread

    def getHedgeRatioDS(self):
        return self.__hedgeRatio

    def __getOrderSize(self, bars, hedgeRatio):
        cash = self.getBroker().getCash(False)
        price1 = bars[self.__i1].getAdjClose()
        price2 = bars[self.__i2].getAdjClose()
        size1 = int(cash / (price1 + hedgeRatio * price2))
        size2 = int(size1 * hedgeRatio)
        return (size1, size2)

    def buySpread(self, bars, hedgeRatio):
        amount1, amount2 = self.__getOrderSize(bars, hedgeRatio)
        self.order(self.__i1, amount1)
        self.order(self.__i2, amount2 * -1)

    def sellSpread(self, bars, hedgeRatio):
        amount1, amount2 = self.__getOrderSize(bars, hedgeRatio)
        self.order(self.__i1, amount1 * -1)
        self.order(self.__i2, amount2)

    def reducePosition(self, instrument):
        currentPos = self.getBroker().getShares(instrument)
        if currentPos > 0:
            self.order(instrument, currentPos * -1)
        elif currentPos < 0:
            self.order(instrument, currentPos * -1)

    def onBars(self, bars):
        self.__statArbHelper.update()

        # These is used only for plotting purposes.
        self.__spread.appendWithDateTime(bars.getDateTime(), self.__statArbHelper.getSpread())
        self.__hedgeRatio.appendWithDateTime(bars.getDateTime(), self.__statArbHelper.getHedgeRatio())

        if bars.getBar(self.__i1) and bars.getBar(self.__i2):
            hedgeRatio = self.__statArbHelper.getHedgeRatio()
            zScore = self.__statArbHelper.getZScore()
            if zScore != None:
                currentPos =  abs(self.getBroker().getShares(self.__i1)) + abs(self.getBroker().getShares(self.__i2))
                if abs(zScore) <= 1 and currentPos != 0:
                    self.reducePosition(self.__i1)
                    self.reducePosition(self.__i2)
                elif zScore <= -2 and currentPos == 0: # Buy spread when its value drops below 2 standard deviations.
                    self.buySpread(bars, hedgeRatio)
                elif zScore >= 2 and currentPos == 0: # Short spread when its value rises above 2 standard deviations.
                    self.sellSpread(bars, hedgeRatio)

def main(plot):
    instruments = ["gld", "gdx"]
    windowSize = 50

    # Download the bars.
    feed = yahoofinance.build_feed(instruments, 2006, 2012, ".")

    myStrategy = MyStrategy(feed, instruments[0], instruments[1], windowSize)

    if plot:
        plt = plotter.StrategyPlotter(myStrategy, False, False, True)
        plt.getOrCreateSubplot("hedge").addDataSeries("Hedge Ratio", myStrategy.getHedgeRatioDS())
        plt.getOrCreateSubplot("spread").addDataSeries("Spread", myStrategy.getSpreadDS())

    myStrategy.run()
    print "Result: %.2f" % myStrategy.getResult()

    if plot:
        plt.plot()

if __name__ == "__main__":
    main(True)
this is what the output should look like:
2013-09-21 00:02:35,136 yahoofinance [INFO] Creating data directory
2013-09-21 00:02:35,136 yahoofinance [INFO] Downloading gld 2006 to data/gld-2006-yahoofinance.csv
2013-09-21 00:02:35,899 yahoofinance [INFO] Downloading gdx 2006 to data/gdx-2006-yahoofinance.csv
2013-09-21 00:02:36,637 yahoofinance [INFO] Downloading gld 2007 to data/gld-2007-yahoofinance.csv
2013-09-21 00:02:37,265 yahoofinance [INFO] Downloading gdx 2007 to data/gdx-2007-yahoofinance.csv
2013-09-21 00:02:37,881 yahoofinance [INFO] Downloading gld 2008 to data/gld-2008-yahoofinance.csv
2013-09-21 00:02:38,462 yahoofinance [INFO] Downloading gdx 2008 to data/gdx-2008-yahoofinance.csv
2013-09-21 00:02:39,243 yahoofinance [INFO] Downloading gld 2009 to data/gld-2009-yahoofinance.csv
2013-09-21 00:02:39,996 yahoofinance [INFO] Downloading gdx 2009 to data/gdx-2009-yahoofinance.csv
2013-09-21 00:02:40,577 yahoofinance [INFO] Downloading gld 2010 to data/gld-2010-yahoofinance.csv
2013-09-21 00:02:42,630 yahoofinance [INFO] Downloading gdx 2010 to data/gdx-2010-yahoofinance.csv
2013-09-21 00:02:43,397 yahoofinance [INFO] Downloading gld 2011 to data/gld-2011-yahoofinance.csv
2013-09-21 00:02:44,153 yahoofinance [INFO] Downloading gdx 2011 to data/gdx-2011-yahoofinance.csv
2013-09-21 00:02:44,901 yahoofinance [INFO] Downloading gld 2012 to data/gld-2012-yahoofinance.csv
2013-09-21 00:02:45,965 yahoofinance [INFO] Downloading gdx 2012 to data/gdx-2012-yahoofinance.csv
Result: 1241843.95
and this is what the plot should look like:
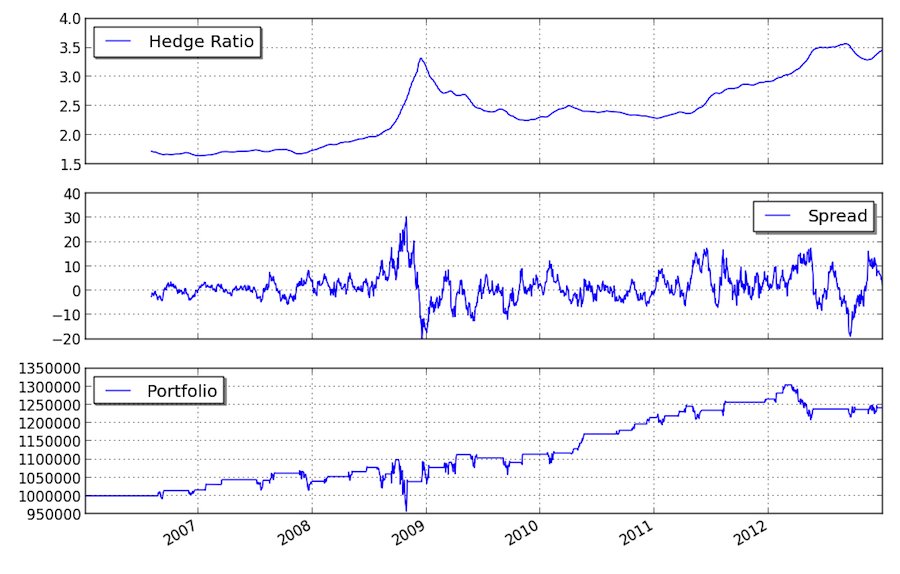
you can get better returns by tunning the window size as well as the entry and exit values for the z-score.