RSI2
This example is based on a strategy known as RSI2 (http://stockcharts.com/school/doku.php?id=chart_school:trading_strategies:rsi2) which requires the following parameters:
- An SMA period for trend identification. We’ll call this entrySMA.
- A smaller SMA period for the exit point. We’ll call this exitSMA.
- An RSI period for entering both short/long positions. We’ll call this rsiPeriod.
- An RSI oversold threshold for long position entry. We’ll call this overSoldThreshold.
- An RSI overbought threshold for short position entry. We’ll call this overBoughtThreshold.
Save this code as rsi2.py:
from pyalgotrade import strategy
from pyalgotrade.technical import ma
from pyalgotrade.technical import rsi
from pyalgotrade.technical import cross


class RSI2(strategy.BacktestingStrategy):
    def __init__(self, feed, instrument, entrySMA, exitSMA, rsiPeriod, overBoughtThreshold, overSoldThreshold):
        super(RSI2, self).__init__(feed)
        self.__instrument = instrument
        # We'll use adjusted close values, if available, instead of regular close values.
        if feed.barsHaveAdjClose():
            self.setUseAdjustedValues(True)
        self.__priceDS = feed[instrument].getPriceDataSeries()
        self.__entrySMA = ma.SMA(self.__priceDS, entrySMA)
        self.__exitSMA = ma.SMA(self.__priceDS, exitSMA)
        self.__rsi = rsi.RSI(self.__priceDS, rsiPeriod)
        self.__overBoughtThreshold = overBoughtThreshold
        self.__overSoldThreshold = overSoldThreshold
        self.__longPos = None
        self.__shortPos = None

    def getEntrySMA(self):
        return self.__entrySMA

    def getExitSMA(self):
        return self.__exitSMA

    def getRSI(self):
        return self.__rsi

    def onEnterCanceled(self, position):
        if self.__longPos == position:
            self.__longPos = None
        elif self.__shortPos == position:
            self.__shortPos = None
        else:
            assert(False)

    def onExitOk(self, position):
        if self.__longPos == position:
            self.__longPos = None
        elif self.__shortPos == position:
            self.__shortPos = None
        else:
            assert(False)

    def onExitCanceled(self, position):
        # If the exit was canceled, re-submit it.
        position.exitMarket()

    def onBars(self, bars):
        # Wait for enough bars to be available to calculate SMA and RSI.
        if self.__exitSMA[-1] is None or self.__entrySMA[-1] is None or self.__rsi[-1] is None:
            return

        bar = bars[self.__instrument]
        if self.__longPos is not None:
            if self.exitLongSignal():
                self.__longPos.exitMarket()
        elif self.__shortPos is not None:
            if self.exitShortSignal():
                self.__shortPos.exitMarket()
        else:
            if self.enterLongSignal(bar):
                shares = int(self.getBroker().getCash() * 0.9 / bars[self.__instrument].getPrice())
                self.__longPos = self.enterLong(self.__instrument, shares, True)
            elif self.enterShortSignal(bar):
                shares = int(self.getBroker().getCash() * 0.9 / bars[self.__instrument].getPrice())
                self.__shortPos = self.enterShort(self.__instrument, shares, True)

    def enterLongSignal(self, bar):
        return bar.getPrice() > self.__entrySMA[-1] and self.__rsi[-1] <= self.__overSoldThreshold

    def exitLongSignal(self):
        return cross.cross_above(self.__priceDS, self.__exitSMA) and not self.__longPos.exitActive()

    def enterShortSignal(self, bar):
        return bar.getPrice() < self.__entrySMA[-1] and self.__rsi[-1] >= self.__overBoughtThreshold

    def exitShortSignal(self):
        return cross.cross_below(self.__priceDS, self.__exitSMA) and not self.__shortPos.exitActive()
and use the following code to execute the strategy:
from __future__ import print_function

import rsi2
from pyalgotrade import plotter
from pyalgotrade.barfeed import yahoofeed
from pyalgotrade.stratanalyzer import sharpe


def main(plot):
    instrument = "DIA"
    entrySMA = 200
    exitSMA = 5
    rsiPeriod = 2
    overBoughtThreshold = 90
    overSoldThreshold = 10

    # Load the bars. These files were manually downloaded from Yahoo Finance.
    feed = yahoofeed.Feed()
    for year in range(2009, 2013):
        fileName = "%s-%d-yahoofinance.csv" % (instrument, year)
        print("Loading bars from %s" % fileName)
        feed.addBarsFromCSV(instrument, fileName)

    strat = rsi2.RSI2(feed, instrument, entrySMA, exitSMA, rsiPeriod, overBoughtThreshold, overSoldThreshold)
    sharpeRatioAnalyzer = sharpe.SharpeRatio()
    strat.attachAnalyzer(sharpeRatioAnalyzer)

    if plot:
        plt = plotter.StrategyPlotter(strat, True, False, True)
        plt.getInstrumentSubplot(instrument).addDataSeries("Entry SMA", strat.getEntrySMA())
        plt.getInstrumentSubplot(instrument).addDataSeries("Exit SMA", strat.getExitSMA())
        plt.getOrCreateSubplot("rsi").addDataSeries("RSI", strat.getRSI())
        plt.getOrCreateSubplot("rsi").addLine("Overbought", overBoughtThreshold)
        plt.getOrCreateSubplot("rsi").addLine("Oversold", overSoldThreshold)

    strat.run()
    print("Sharpe ratio: %.2f" % sharpeRatioAnalyzer.getSharpeRatio(0.05))

    if plot:
        plt.plot()


if __name__ == "__main__":
    main(True)
This is what the output should look like:
Loading bars from DIA-2009-yahoofinance.csv
Loading bars from DIA-2010-yahoofinance.csv
Loading bars from DIA-2011-yahoofinance.csv
Loading bars from DIA-2012-yahoofinance.csv
Sharpe ratio: -0.11
and this is what the plot should look like:
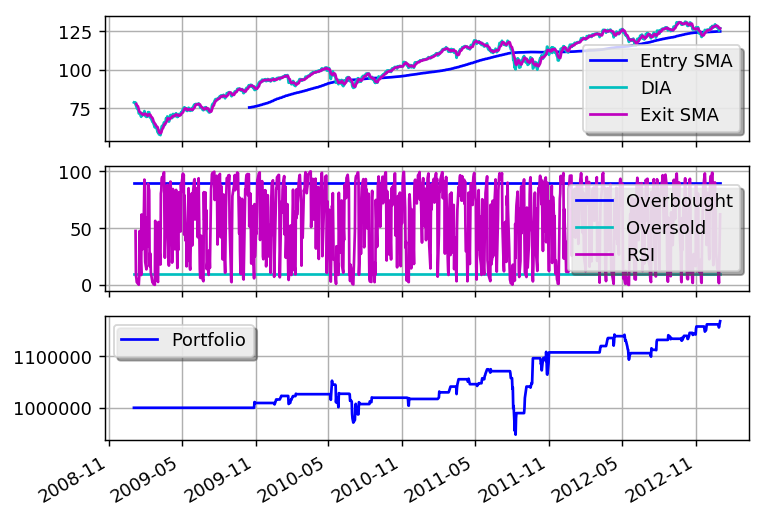
You can get better returns by tunning the different parameters.