Tutorial
The goal of this tutorial is to give you a quick introduction to PyAlgoTrade. As described in the introduction, the goal of PyAlgoTrade is to help you backtest stock trading strategies. Let’s say you have an idea for a trading strategy and you’d like to evaluate it with historical data and see how it behaves, then PyAlgoTrade should allow you to do so with minimal effort.
Before I move on I would like to thank Pablo Jorge who helped reviewing the design and documentation.
This tutorial was developed on a UNIX environment, but the steps to adapt it to a Windows environment should be straightforward.
The PyAlgoTrade library has 4 main components:
- Strategies
- Technicals
- Feeds
- Optimizer
- Strategies
- These are the classes that you define, that implement a certain trading strategy. When to buy, when to sell, etc.
- Technicals
- These are a set of filters that you use to make calculations over a stream of values to decide what to do. For example SMA (Simple Moving Average), RSI (Relative Strength Index), etc.
- Feeds
- These are data providing abstractions. For example, you’ll use a CSV feed that loads bars from a CSV (Comma-separated values) formatted file to feed data to a strategy.
- Optimizer
- These are a set of classes that allow you to distribute backtesting among different computers, or different processes running in the same computer, or a combination of both. They make horizontal scaling easy.
Having said all that, the first thing that we’ll need to test our strategy is some data. Let’s use Oracle’s stock prices for year 2000, which we’ll download with the following command:
python -c "from pyalgotrade.tools import yahoofinance; print yahoofinance.get_daily_csv('orcl', 2000)"
The output should look like this:
Date,Open,High,Low,Close,Volume,Adj Close
2000-12-29,30.87,31.31,28.69,29.06,31655500,28.35
2000-12-28,30.56,31.12,30.37,31.06,25055600,30.30
2000-12-27,30.37,31.06,29.37,30.69,26441700,29.94
.
.
2000-01-04,115.50,118.62,105.00,107.69,116850000,26.26
2000-01-03,124.62,125.19,111.62,118.12,98122000,28.81
The pyalgotrade.tools.yahoofinance package downloads CSV formatted data from Yahoo! Finance. Let’s save that as orcl-2000.csv with the following command:
python -c "from pyalgotrade.tools import yahoofinance; print yahoofinance.get_daily_csv('orcl', 2000)" > orcl-2000.csv
Let’s start with a simple strategy, that is, one that just prints closing prices as they are processed:
from pyalgotrade import strategy
from pyalgotrade.barfeed import yahoofeed

class MyStrategy(strategy.Strategy):
    def __init__(self, feed):
        strategy.Strategy.__init__(self, feed)

    def onBars(self, bars):
        bar = bars.getBar("orcl")
        print "%s: %s" % (bar.getDateTime(), bar.getClose())

# Load the yahoo feed from the CSV file
feed = yahoofeed.Feed()
feed.addBarsFromCSV("orcl", "orcl-2000.csv")

# Evaluate the strategy with the feed's bars.
myStrategy = MyStrategy(feed)
myStrategy.run()
- The code is doing 3 main things:
- Declaring a new strategy. There is only one method that has to be defined, onBars, which is called for every bar in the feed.
- Loading the feed from a CSV file.
- Running the strategy with the bars supplied by the feed.
If you run the script you should see the closing prices in order:
2000-01-03 00:00:00: 118.12
2000-01-04 00:00:00: 107.69
.
.
2000-12-28 00:00:00: 31.06
2000-12-29 00:00:00: 29.06
Let’s move on with a strategy that prints closing SMA prices, to illustrate how technicals are used:
from pyalgotrade import strategy
from pyalgotrade.barfeed import yahoofeed
from pyalgotrade.technical import ma

class MyStrategy(strategy.Strategy):
    def __init__(self, feed):
        strategy.Strategy.__init__(self, feed)
        # We want a 15 period SMA over the closing prices.
        self.__sma = ma.SMA(feed.getDataSeries("orcl").getCloseDataSeries(), 15)

    def onBars(self, bars):
        bar = bars.getBar("orcl")
        print "%s: %s %s" % (bar.getDateTime(), bar.getClose(), self.__sma.getValue())

# Load the yahoo feed from the CSV file
feed = yahoofeed.Feed()
feed.addBarsFromCSV("orcl", "orcl-2000.csv")

# Evaluate the strategy with the feed's bars.
myStrategy = MyStrategy(feed)
myStrategy.run()
This is very similar to the previous example, except that:
- We’re initializing an SMA filter over the closing price data series.
- We’re printing the current SMA value along with the closing price.
If you run the script you should see the closing prices and the corresponding SMA values, but in this case the first 14 SMA values are None. That is because we need at least 15 values to get something out of the SMA:
2000-01-03 00:00:00: 118.12 None
2000-01-04 00:00:00: 107.69 None
2000-01-05 00:00:00: 102.0 None
2000-01-06 00:00:00: 96.0 None
2000-01-07 00:00:00: 103.37 None
2000-01-10 00:00:00: 115.75 None
2000-01-11 00:00:00: 112.37 None
2000-01-12 00:00:00: 105.62 None
2000-01-13 00:00:00: 105.06 None
2000-01-14 00:00:00: 106.81 None
2000-01-18 00:00:00: 111.25 None
2000-01-19 00:00:00: 57.13 None
2000-01-20 00:00:00: 59.25 None
2000-01-21 00:00:00: 59.69 None
2000-01-24 00:00:00: 54.19 94.2866666667
2000-01-25 00:00:00: 56.44 90.1746666667
.
.
2000-12-28 00:00:00: 31.06 30.0446666667
2000-12-29 00:00:00: 29.06 30.0946666667
All the technicals will return None when the value can’t be calculated at a given time.
One important thing about technicals is that they can be stacked. That is because they’re modeled as data series too. For example, getting an SMA over the RSI over the closing prices is as simple as this:
from pyalgotrade import strategy
from pyalgotrade.barfeed import yahoofeed
from pyalgotrade.technical import ma
from pyalgotrade.technical import rsi

class MyStrategy(strategy.Strategy):
    def __init__(self, feed):
        strategy.Strategy.__init__(self, feed)
        self.__rsi = rsi.RSI(feed.getDataSeries("orcl").getCloseDataSeries(), 14)
        self.__sma = ma.SMA(self.__rsi, 15)

    def onBars(self, bars):
        bar = bars.getBar("orcl")
        print "%s: %s %s %s" % (bar.getDateTime(), bar.getClose(), self.__rsi.getValue(), self.__sma.getValue())

# Load the yahoo feed from the CSV file
feed = yahoofeed.Feed()
feed.addBarsFromCSV("orcl", "orcl-2000.csv")

# Evaluate the strategy with the feed's bars.
myStrategy = MyStrategy(feed)
myStrategy.run()
If you run the script you should see a bunch of values on the screen where:
- The first 14 RSI values are None. That is because we need at least 15 values to get an RSI value.
- The first 28 SMA values are None. That is because the first 14 RSI values are None, and the 15th one is the first not None value that the SMA filter receives. Only when we have 15 not None values we can calculate the SMA(15).
2000-01-03 00:00:00: 118.12 None None
2000-01-04 00:00:00: 107.69 None None
2000-01-05 00:00:00: 102.0 None None
2000-01-06 00:00:00: 96.0 None None
2000-01-07 00:00:00: 103.37 None None
2000-01-10 00:00:00: 115.75 None None
2000-01-11 00:00:00: 112.37 None None
2000-01-12 00:00:00: 105.62 None None
2000-01-13 00:00:00: 105.06 None None
2000-01-14 00:00:00: 106.81 None None
2000-01-18 00:00:00: 111.25 None None
2000-01-19 00:00:00: 57.13 None None
2000-01-20 00:00:00: 59.25 None None
2000-01-21 00:00:00: 59.69 None None
2000-01-24 00:00:00: 54.19 23.5673530141 None
2000-01-25 00:00:00: 56.44 25.0687519877 None
2000-01-26 00:00:00: 55.06 24.7476577095 None
2000-01-27 00:00:00: 51.81 23.9690136517 None
2000-01-28 00:00:00: 47.38 22.9108539956 None
2000-01-31 00:00:00: 49.95 24.980004823 None
2000-02-01 00:00:00: 54.0 28.2484181864 None
2000-02-02 00:00:00: 54.31 28.505177315 None
2000-02-03 00:00:00: 56.69 30.5596770599 None
2000-02-04 00:00:00: 57.81 31.5564353751 None
2000-02-07 00:00:00: 59.94 33.5111056589 None
2000-02-08 00:00:00: 59.56 33.3282358994 None
2000-02-09 00:00:00: 59.94 33.7177605915 None
2000-02-10 00:00:00: 62.31 36.2205441255 None
2000-02-11 00:00:00: 59.69 34.6623493641 29.0368892505
2000-02-14 00:00:00: 62.19 37.4284445543 29.9609620198
.
.
2000-12-28 00:00:00: 31.06 52.1646203455 49.997518354
2000-12-29 00:00:00: 29.06 47.3776678335 50.0790646925
Trading
Let’s move on with a simple strategy, this time simulating actual trading. The idea is very simple:
- If the closing price is above the SMA(15) we enter a long position (we place a buy market order).
- If a long order is in place, and the closing price drops below the SMA(15) we exit the long position (we place a sell market order).
from pyalgotrade import strategy
from pyalgotrade.barfeed import yahoofeed
from pyalgotrade.technical import ma

class MyStrategy(strategy.Strategy):
    def __init__(self, feed, smaPeriod):
        strategy.Strategy.__init__(self, feed, 1000)
        self.__sma = ma.SMA(feed.getDataSeries("orcl").getCloseDataSeries(), smaPeriod)
        self.__position = None

    def onStart(self):
        print "Initial portfolio value: $%.2f" % self.getBroker().getCash()

    def onEnterOk(self, position):
        execInfo = position.getEntryOrder().getExecutionInfo()
        print "%s: BUY at $%.2f" % (execInfo.getDateTime(), execInfo.getPrice())

    def onEnterCanceled(self, position):
        self.__position = None

    def onExitOk(self, position):
        execInfo = position.getExitOrder().getExecutionInfo()
        print "%s: SELL at $%.2f" % (execInfo.getDateTime(), execInfo.getPrice())
        self.__position = None

    def onExitCanceled(self, position):
        # If the exit was canceled, re-submit it.
        self.exitPosition(self.__position)

    def onBars(self, bars):
        # Wait for enough bars to be available to calculate a SMA.
        if self.__sma.getValue() is None:
            return

        bar = bars.getBar("orcl")
        # If a position was not opened, check if we should enter a long position.
        if self.__position == None:
            if bar.getClose() > self.__sma.getValue():
                # Enter a buy market order for 10 orcl shares. The order is good till canceled.
                self.__position = self.enterLong("orcl", 10, True)
        # Check if we have to exit the position.
        elif bar.getClose() < self.__sma.getValue():
             self.exitPosition(self.__position)

    def onFinish(self, bars):
        print "Final portfolio value: $%.2f" % self.getBroker().getValue(bars)

def run_strategy(smaPeriod):
    # Load the yahoo feed from the CSV file
    feed = yahoofeed.Feed()
    feed.addBarsFromCSV("orcl", "orcl-2000.csv")

    # Evaluate the strategy with the feed's bars.
    myStrategy = MyStrategy(feed, smaPeriod)
    myStrategy.run()

run_strategy(15)
If you run the script you should see something like this:
Initial portfolio value: $1000.00
2000-02-08 00:00:00: BUY at $60.75
2000-02-22 00:00:00: SELL at $59.13
2000-02-23 00:00:00: BUY at $60.19
2000-03-31 00:00:00: SELL at $80.19
2000-04-07 00:00:00: BUY at $83.69
2000-04-12 00:00:00: SELL at $77.94
2000-04-19 00:00:00: BUY at $78.62
2000-04-20 00:00:00: SELL at $73.81
2000-04-28 00:00:00: BUY at $78.50
2000-05-05 00:00:00: SELL at $74.00
2000-05-08 00:00:00: BUY at $75.31
2000-05-09 00:00:00: SELL at $73.69
2000-05-16 00:00:00: BUY at $77.62
2000-05-19 00:00:00: SELL at $72.00
2000-05-31 00:00:00: BUY at $73.25
2000-06-23 00:00:00: SELL at $80.81
2000-06-27 00:00:00: BUY at $82.37
2000-06-28 00:00:00: SELL at $82.06
2000-06-29 00:00:00: BUY at $82.06
2000-06-30 00:00:00: SELL at $80.37
2000-07-03 00:00:00: BUY at $81.12
2000-07-05 00:00:00: SELL at $76.81
2000-07-21 00:00:00: BUY at $77.44
2000-07-24 00:00:00: SELL at $77.12
2000-07-26 00:00:00: BUY at $74.81
2000-07-28 00:00:00: SELL at $75.12
2000-08-01 00:00:00: BUY at $75.19
2000-08-02 00:00:00: SELL at $73.00
2000-08-04 00:00:00: BUY at $78.31
2000-09-11 00:00:00: SELL at $86.06
2000-09-29 00:00:00: BUY at $81.36
2000-10-02 00:00:00: SELL at $79.75
2000-11-20 00:00:00: BUY at $24.31
2000-11-21 00:00:00: SELL at $24.81
2000-12-01 00:00:00: BUY at $26.37
2000-12-15 00:00:00: SELL at $29.44
2000-12-18 00:00:00: BUY at $30.00
2000-12-21 00:00:00: SELL at $27.81
2000-12-22 00:00:00: BUY at $30.37
Final portfolio value: $1013.40
But what if we used 30 as the SMA period instead of 15 ? Would that yield better results or worse ? We could certainly do something like this:
for i in range(10, 30):
    run_strategy(i)
and we would find out that we can get better results with a SMA(20):
Final portfolio value: $1124.90
This is ok if we only have to try a limited set of parameters values. But if we have to test a strategy with multiple parameters, then the serial approach is definitely not going to scale as strategies get more complex.
Optimizing
Meet the optimizer component. The idea is very simple:
- There is one server responsible for:
- Providing the bars to run the strategy.
- Providing the parameters to run the strategy.
- Recording the strategy results from each of the workers.
- There are multiple workers responsible for:
- Running the strategy with the bars and parameters provided by the server.
To illustrate this we’ll use a strategy known as RSI2 (http://stockcharts.com/school/doku.php?id=chart_school:trading_strategies:rsi2) which requires the following parameters:
- An SMA period for trend identification. We’ll call this entrySMA and will range between 150 and 250.
- A smaller SMA period for the exit point. We’ll call this exitSMA and will range between 5 and 15.
- An RSI period for entering both short/long positions. We’ll call this rsiPeriod and will range between 2 and 10.
- An RSI oversold threshold for long position entry. We’ll call this overSoldThreshold and will range between 5 and 25.
- An RSI overbought threshold for short position entry. We’ll call this overBoughtThreshold and will range between 75 and 95.
If my math is ok, those are 4409559 different combinations.
Testing this strategy for one set of parameters took me about 0.16 seconds. If I execute all the combinations serially it’ll take me about 8.5 days to evaluate all of them and find the best set of parameters. That is a long time, but if I can get ten 8-core computers to do the job then the total time will go down to about 2.5 hours.
Long story short, we need to go parallel.
Let’s start by downloading 3 years of daily bars for ‘Dow Jones Industrial Average’:
python -c "from pyalgotrade.tools import yahoofinance; print yahoofinance.get_daily_csv('dia', 2009)" > dia-2009.csv
python -c "from pyalgotrade.tools import yahoofinance; print yahoofinance.get_daily_csv('dia', 2010)" > dia-2010.csv
python -c "from pyalgotrade.tools import yahoofinance; print yahoofinance.get_daily_csv('dia', 2011)" > dia-2011.csv
This is the server script:
import itertools
from pyalgotrade.barfeed import yahoofeed
from pyalgotrade.optimizer import server

def parameters_generator():
    entrySMA = range(150, 251)
    exitSMA = range(5, 16)
    rsiPeriod = range(2, 11)
    overBoughtThreshold = range(75, 96)
    overSoldThreshold = range(5, 26)
    return itertools.product(entrySMA, exitSMA, rsiPeriod, overBoughtThreshold, overSoldThreshold)

# The if __name__ == '__main__' part is necessary if running on Windows.
if __name__ == '__main__':
    # Load the feed from the CSV files.
    feed = yahoofeed.Feed()
    feed.addBarsFromCSV("dia", "dia-2009.csv")
    feed.addBarsFromCSV("dia", "dia-2010.csv")
    feed.addBarsFromCSV("dia", "dia-2011.csv")

    # Run the server.
    server.serve(feed, parameters_generator(), "localhost", 5000)
The server code is doing 3 things:
- Declaring a generator function that builds parameters.
- Loading the feed with the CSV files we downloaded.
- Running the server that will wait for incoming connections on port 5000.
This is the worker script:
from pyalgotrade.optimizer import worker
from pyalgotrade import strategy
from pyalgotrade.technical import ma
from pyalgotrade.technical import rsi

class MyStrategy(strategy.Strategy):
    def __init__(self, feed, entrySMA, exitSMA, rsiPeriod, overBoughtThreshold, overSoldThreshold):
        strategy.Strategy.__init__(self, feed, 2000)
        ds = feed.getDataSeries("dia").getCloseDataSeries()
        self.__entrySMA = ma.SMA(ds, entrySMA)
        self.__exitSMA = ma.SMA(ds, exitSMA)
        self.__rsi = rsi.RSI(ds, rsiPeriod)
        self.__overBoughtThreshold = overBoughtThreshold
        self.__overSoldThreshold = overSoldThreshold
        self.__longPos = None
        self.__shortPos = None

    def onEnterOk(self, position):
        pass

    def onEnterCanceled(self, position):
        if self.__longPos == position:
            self.__longPos = None
        elif self.__shortPos == position:
            self.__shortPos = None
        else:
            assert(False)

    def onExitOk(self, position):
        if self.__longPos == position:
            self.__longPos = None
        elif self.__shortPos == position:
            self.__shortPos = None
        else:
            assert(False)

    def onExitCanceled(self, position):
        # If the exit was canceled, re-submit it.
        self.exitPosition(position)

    def onBars(self, bars):
        # Wait for enough bars to be available to calculate SMA and RSI.
        if self.__exitSMA.getValue() is None or self.__entrySMA.getValue() is None or self.__rsi.getValue() is None:
            return

        bar = bars.getBar("dia")
        if self.__longPos != None:
            if self.exitLongSignal(bar):
                self.exitPosition(self.__longPos)
        elif self.__shortPos != None:
            if self.exitShortSignal(bar):
                self.exitPosition(self.__shortPos)
        else:
            if self.enterLongSignal(bar):
                self.__longPos = self.enterLong("dia", 10, True)
            elif self.enterShortSignal(bar):
                self.__shortPos = self.enterShort("dia", 10, True)

    def enterLongSignal(self, bar):
        return bar.getClose() > self.__entrySMA.getValue() and self.__rsi.getValue() <= self.__overSoldThreshold

    def exitLongSignal(self, bar):
        return bar.getClose() > self.__exitSMA.getValue()

    def enterShortSignal(self, bar):
        return bar.getClose() < self.__entrySMA.getValue() and self.__rsi.getValue() >= self.__overBoughtThreshold

    def exitShortSignal(self, bar):
        return bar.getClose() < self.__exitSMA.getValue()

# The if __name__ == '__main__' part is necessary if running on Windows.
if __name__ == '__main__':
    worker.run(MyStrategy, "localhost", 5000)
The worker code is doing 2 things:
- Declaring the RSI2 strategy.
- Using pyalgotrade.optimizer.worker module to run the strategy in parallel with the data supplied by the server.
When you run the server and the client/s you’ll see something like this on the server console:
INFO 2012-03-24 22:29:29,860: Loading bars
INFO 2012-03-24 22:29:30,053: Waiting for workers
INFO 2012-03-24 22:29:33,640: Partial result $2036.90 with parameters: (150, 5, 2, 75, 5)
INFO 2012-03-24 22:29:33,769: Partial result $2089.20 with parameters: (150, 5, 2, 76, 5)
INFO 2012-03-24 22:29:33,896: Partial result $2100.40 with parameters: (150, 5, 2, 77, 5)
INFO 2012-03-24 22:29:34,025: Partial result $2100.40 with parameters: (150, 5, 2, 78, 5)
INFO 2012-03-24 22:29:34,153: Partial result $2100.40 with parameters: (150, 5, 2, 79, 5)
INFO 2012-03-24 22:29:34,280: Partial result $2112.20 with parameters: (150, 5, 2, 80, 5)
.
.
and something like this on the worker/s console:
INFO 2012-03-24 22:29:33,515: Running strategy with parameters (150, 5, 2, 75, 5)
INFO 2012-03-24 22:29:33,638: Result 2036.9
INFO 2012-03-24 22:29:33,643: Running strategy with parameters (150, 5, 2, 76, 5)
INFO 2012-03-24 22:29:33,767: Result 2089.2
INFO 2012-03-24 22:29:33,772: Running strategy with parameters (150, 5, 2, 77, 5)
INFO 2012-03-24 22:29:33,895: Result 2100.4
INFO 2012-03-24 22:29:33,899: Running strategy with parameters (150, 5, 2, 78, 5)
INFO 2012-03-24 22:29:34,023: Result 2100.4
INFO 2012-03-24 22:29:34,028: Running strategy with parameters (150, 5, 2, 79, 5)
INFO 2012-03-24 22:29:34,151: Result 2100.4
INFO 2012-03-24 22:29:34,156: Running strategy with parameters (150, 5, 2, 80, 5)
INFO 2012-03-24 22:29:34,278: Result 2112.2
.
.
Note that you should run only one server and one or more workers in different computers.
If you just want to run strategies in parallel in your own desktop you can take advantage of the pyalgotrade.optimizer.local module like this:
import itertools
from pyalgotrade.optimizer import local
from pyalgotrade.barfeed import yahoofeed
from pyalgotrade import strategy
from pyalgotrade.technical import ma
from pyalgotrade.technical import rsi

class MyStrategy(strategy.Strategy):
    def __init__(self, feed, entrySMA, exitSMA, rsiPeriod, overBoughtThreshold, overSoldThreshold):
        strategy.Strategy.__init__(self, feed, 2000)
        ds = feed.getDataSeries("dia").getCloseDataSeries()
        self.__entrySMA = ma.SMA(ds, entrySMA)
        self.__exitSMA = ma.SMA(ds, exitSMA)
        self.__rsi = rsi.RSI(ds, rsiPeriod)
        self.__overBoughtThreshold = overBoughtThreshold
        self.__overSoldThreshold = overSoldThreshold
        self.__longPos = None
        self.__shortPos = None

    def onEnterOk(self, position):
        pass

    def onEnterCanceled(self, position):
        if self.__longPos == position:
            self.__longPos = None
        elif self.__shortPos == position:
            self.__shortPos = None
        else:
            assert(False)

    def onExitOk(self, position):
        if self.__longPos == position:
            self.__longPos = None
        elif self.__shortPos == position:
            self.__shortPos = None
        else:
            assert(False)

    def onExitCanceled(self, position):
        # If the exit was canceled, re-submit it.
        self.exitPosition(position)

    def onBars(self, bars):
        # Wait for enough bars to be available to calculate SMA and RSI.
        if self.__exitSMA.getValue() is None or self.__entrySMA.getValue() is None or self.__rsi.getValue() is None:
            return

        bar = bars.getBar("dia")
        if self.__longPos != None:
            if self.exitLongSignal(bar):
                self.exitPosition(self.__longPos)
        elif self.__shortPos != None:
            if self.exitShortSignal(bar):
                self.exitPosition(self.__shortPos)
        else:
            if self.enterLongSignal(bar):
                self.__longPos = self.enterLong("dia", 10, True)
            elif self.enterShortSignal(bar):
                self.__shortPos = self.enterShort("dia", 10, True)

    def enterLongSignal(self, bar):
        return bar.getClose() > self.__entrySMA.getValue() and self.__rsi.getValue() <= self.__overSoldThreshold

    def exitLongSignal(self, bar):
        return bar.getClose() > self.__exitSMA.getValue()

    def enterShortSignal(self, bar):
        return bar.getClose() < self.__entrySMA.getValue() and self.__rsi.getValue() >= self.__overBoughtThreshold

    def exitShortSignal(self, bar):
        return bar.getClose() < self.__exitSMA.getValue()

def parameters_generator():
    entrySMA = range(150, 251)
    exitSMA = range(5, 16)
    rsiPeriod = range(2, 11)
    overBoughtThreshold = range(75, 96)
    overSoldThreshold = range(5, 26)
    return itertools.product(entrySMA, exitSMA, rsiPeriod, overBoughtThreshold, overSoldThreshold)

# The if __name__ == '__main__' part is necessary if running on Windows.
if __name__ == '__main__':
    # Load the feed from the CSV files.
    feed = yahoofeed.Feed()
    feed.addBarsFromCSV("dia", "dia-2009.csv")
    feed.addBarsFromCSV("dia", "dia-2010.csv")
    feed.addBarsFromCSV("dia", "dia-2011.csv")

    local.run(MyStrategy, feed, parameters_generator())
The code is doing 4 things:
- Declaring the RSI2 strategy.
- Declaring a generator function that builds parameters.
- Loading the feed with the CSV files we downloaded.
- Using the pyalgotrade.optimizer.local module to run the strategy in parallel and find the best result.
When you run this code you should see something like this:
INFO 2012-03-25 00:07:34,793: Loading bars
INFO 2012-03-25 00:07:34,996: Waiting for workers
INFO 2012-03-25 00:07:35,366: Partial result $2036.90 with parameters: (150, 5, 2, 75, 5)
INFO 2012-03-25 00:07:35,385: Partial result $2089.20 with parameters: (150, 5, 2, 76, 5)
INFO 2012-03-25 00:07:35,499: Partial result $2100.40 with parameters: (150, 5, 2, 77, 5)
INFO 2012-03-25 00:07:35,515: Partial result $2100.40 with parameters: (150, 5, 2, 78, 5)
INFO 2012-03-25 00:07:35,632: Partial result $2100.40 with parameters: (150, 5, 2, 79, 5)
INFO 2012-03-25 00:07:35,646: Partial result $2112.20 with parameters: (150, 5, 2, 80, 5)
INFO 2012-03-25 00:07:35,763: Partial result $2115.50 with parameters: (150, 5, 2, 81, 5)
INFO 2012-03-25 00:07:35,775: Partial result $2076.60 with parameters: (150, 5, 2, 82, 5)
INFO 2012-03-25 00:07:35,895: Partial result $2003.60 with parameters: (150, 5, 2, 83, 5)
INFO 2012-03-25 00:07:35,902: Partial result $2003.60 with parameters: (150, 5, 2, 84, 5)
INFO 2012-03-25 00:07:36,026: Partial result $2003.60 with parameters: (150, 5, 2, 85, 5)
INFO 2012-03-25 00:07:36,033: Partial result $2048.60 with parameters: (150, 5, 2, 86, 5)
INFO 2012-03-25 00:07:36,157: Partial result $2061.70 with parameters: (150, 5, 2, 87, 5)
INFO 2012-03-25 00:07:36,163: Partial result $2075.00 with parameters: (150, 5, 2, 88, 5)
INFO 2012-03-25 00:07:36,288: Partial result $2082.00 with parameters: (150, 5, 2, 89, 5)
INFO 2012-03-25 00:07:36,293: Partial result $2080.70 with parameters: (150, 5, 2, 90, 5)
INFO 2012-03-25 00:07:36,418: Partial result $2086.80 with parameters: (150, 5, 2, 91, 5)
INFO 2012-03-25 00:07:36,424: Partial result $2086.80 with parameters: (150, 5, 2, 92, 5)
.
.
- For the record, the best result found was $2314.40 with the following parameters:
- entrySMA: 154
- exitSMA: 5
- rsiPeriod: 2
- overBoughtThreshold: 91
- overSoldThreshold: 18
If you don’t have access to a cluster of computers, then you can take advantage of Google App Engine support.
Plotting
PyAlgoTrade makes it very easy to plot a strategy execution.
from pyalgotrade import strategy
from pyalgotrade import plotter
from pyalgotrade.barfeed import yahoofeed
from pyalgotrade.technical import ma
from pyalgotrade.technical import cross
class MyStrategy(strategy.Strategy):
def __init__(self, feed, smaPeriod):
strategy.Strategy.__init__(self, feed, 1000)
closeDS = feed.getDataSeries("orcl").getCloseDataSeries()
self.__sma = ma.SMA(closeDS, smaPeriod)
self.__crossAbove = cross.CrossAbove(closeDS, self.__sma)
self.__crossBelow = cross.CrossBelow(closeDS, self.__sma)
self.__position = None
def getSMA(self):
return self.__sma
def onEnterCanceled(self, position):
self.__position = None
def onExitOk(self, position):
self.__position = None
def onExitCanceled(self, position):
# If the exit was canceled, re-submit it.
self.exitPosition(self.__position)
def onBars(self, bars):
# Wait for enough bars to be available to calculate the CrossAbove indicator.
if self.__crossAbove is None:
return
# If a position was not opened, check if we should enter a long position.
if self.__position == None:
if self.__crossAbove.getValue() > 0:
# Enter a buy market order for 10 orcl shares. The order is good till canceled.
self.__position = self.enterLong("orcl", 10, True)
# Check if we have to exit the position.
elif self.__crossBelow.getValue() > 0:
self.exitPosition(self.__position)
def onFinish(self, bars):
print "Final portfolio value: $%.2f" % self.getResult()
def run_strategy(smaPeriod):
# Load the yahoo feed from the CSV file
feed = yahoofeed.Feed()
feed.addBarsFromCSV("orcl", "orcl-2000.csv")
# Evaluate the strategy with the feed's bars.
myStrategy = MyStrategy(feed, smaPeriod)
# Attach the strategy to the plotter.
plt = plotter.StrategyPlotter(myStrategy)
# Include the SMA in the instrument's subplot to get it displayed along with the closing prices.
plt.getInstrumentSubplot("orcl").addDataSeries("SMA", myStrategy.getSMA())
# Run the strategy.
myStrategy.run()
# Plot the strategy.
plt.plot()
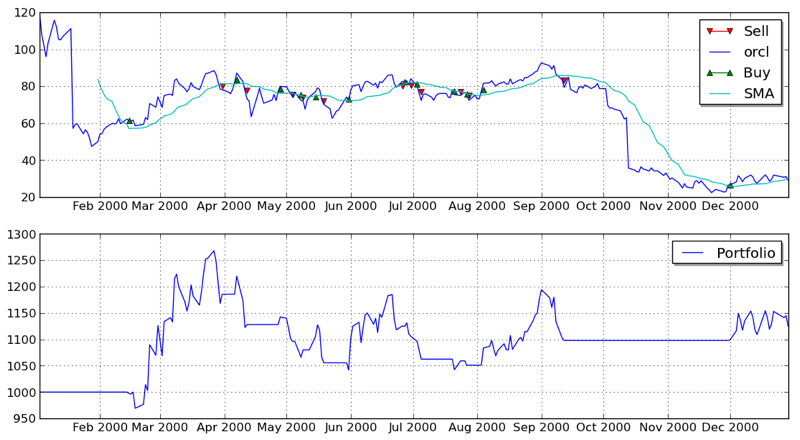
run_strategy(20)
The code is doing 4 things:
- Declaring the strategy. In this case a simple SMA crossover.
- Loading the feed from a CSV file.
- Running the strategy with the bars supplied by the feed and a StrategyPlotter attached.
- Plotting the strategy.
This is what the plot looks like:
I hope you enjoyed this quick introduction. I’d recommend you to download PyAlgoTrade here: http://gbeced.github.com/pyalgotrade/downloads/index.html and get started writing you own strategies.