Ernie Chan’s Gold vs. Gold Miners
- This sample is based on:
from pyalgotrade import strategy
from pyalgotrade import dataseries
from pyalgotrade.dataseries import aligned
from pyalgotrade.barfeed import yahoofeed
from pyalgotrade import plotter
from pyalgotrade.tools import yahoofinance

import numpy as np
import os
import statsmodels.api as sm

def get_beta(values1, values2):
    # http://statsmodels.sourceforge.net/stable/regression.html
    model = sm.OLS(values1, values2)
    results = model.fit()
    return results.params[0]

class StatArbHelper:
    def __init__(self, ds1, ds2, windowSize):
        # We're going to use datetime aligned versions of the dataseries.
        self.__ds1, self.__ds2 = aligned.datetime_aligned(ds1, ds2)
        self.__windowSize = windowSize
        self.__hedgeRatio = None
        self.__spread = None
        self.__spreadMean = None
        self.__spreadStd = None
        self.__zScore = None

    def getSpread(self):
        return self.__spread

    def getSpreadMean(self):
        return self.__spreadMean

    def getSpreadStd(self):
        return self.__spreadStd

    def getZScore(self):
        return self.__zScore

    def getHedgeRatio(self):
        return self.__hedgeRatio

    def __updateHedgeRatio(self, values1, values2):
        self.__hedgeRatio = get_beta(values1, values2)

    def __updateSpreadMeanAndStd(self, values1, values2):
        if self.__hedgeRatio != None:
            spread = values1 - values2 * self.__hedgeRatio
            self.__spreadMean = spread.mean()
            self.__spreadStd = spread.std(ddof=1)

    def __updateSpread(self):
        if self.__hedgeRatio != None:
            self.__spread = self.__ds1[-1] - self.__hedgeRatio * self.__ds2[-1]

    def __updateZScore(self):
        if  self.__spread != None and self.__spreadMean != None and self.__spreadStd != None:
            self.__zScore = (self.__spread - self.__spreadMean) / float(self.__spreadStd)

    def update(self):
        if len(self.__ds1) >= self.__windowSize:
            values1 = np.array(self.__ds1[-1*self.__windowSize:])
            values2 = np.array(self.__ds2[-1*self.__windowSize:])
            self.__updateHedgeRatio(values1, values2)
            self.__updateSpread()
            self.__updateSpreadMeanAndStd(values1, values2)
            self.__updateZScore()

class MyStrategy(strategy.BacktestingStrategy):
    def __init__(self, feed, instrument1, instrument2, windowSize):
        strategy.BacktestingStrategy.__init__(self, feed)
        self.getBroker().setUseAdjustedValues(True)
        self.__statArbHelper = StatArbHelper(feed[instrument1].getAdjCloseDataSeries(), feed[instrument2].getAdjCloseDataSeries(), windowSize)
        self.__i1 = instrument1
        self.__i2 = instrument2

        # These are used only for plotting purposes.
        self.__spread = dataseries.SequenceDataSeries()
        self.__hedgeRatio = dataseries.SequenceDataSeries()

    def getSpreadDS(self):
        return self.__spread

    def getHedgeRatioDS(self):
        return self.__hedgeRatio

    def __getOrderSize(self, bars, hedgeRatio):
        cash = self.getBroker().getCash(False)
        price1 = bars[self.__i1].getAdjClose()
        price2 = bars[self.__i2].getAdjClose()
        size1 = int(cash / (price1 + hedgeRatio * price2))
        size2 = int(size1 * hedgeRatio)
        return (size1, size2)

    def buySpread(self, bars, hedgeRatio):
        amount1, amount2 = self.__getOrderSize(bars, hedgeRatio)
        self.order(self.__i1, amount1)
        self.order(self.__i2, amount2 * -1)

    def sellSpread(self, bars, hedgeRatio):
        amount1, amount2 = self.__getOrderSize(bars, hedgeRatio)
        self.order(self.__i1, amount1 * -1)
        self.order(self.__i2, amount2)

    def reducePosition(self, instrument):
        currentPos = self.getBroker().getShares(instrument)
        if currentPos > 0:
            self.order(instrument, currentPos * -1)
        elif currentPos < 0:
            self.order(instrument, currentPos * -1)

    def onBars(self, bars):
        self.__statArbHelper.update()

        # These is used only for plotting purposes.
        self.__spread.appendWithDateTime(bars.getDateTime(), self.__statArbHelper.getSpread())
        self.__hedgeRatio.appendWithDateTime(bars.getDateTime(), self.__statArbHelper.getHedgeRatio())

        if bars.getBar(self.__i1) and bars.getBar(self.__i2):
            hedgeRatio = self.__statArbHelper.getHedgeRatio()
            zScore = self.__statArbHelper.getZScore()
            if zScore != None:
                currentPos =  abs(self.getBroker().getShares(self.__i1)) + abs(self.getBroker().getShares(self.__i2))
                if abs(zScore) <= 1 and currentPos != 0:
                    self.reducePosition(self.__i1)
                    self.reducePosition(self.__i2)
                elif zScore <= -2 and currentPos == 0: # Buy spread when its value drops below 2 standard deviations.
                    self.buySpread(bars, hedgeRatio)
                elif zScore >= 2 and currentPos == 0: # Short spread when its value rises above 2 standard deviations.
                    self.sellSpread(bars, hedgeRatio)

def build_feed(instruments, fromYear, toYear):
    feed = yahoofeed.Feed()

    for year in range(fromYear, toYear+1):
        for symbol in instruments:
            fileName = "%s-%d-yahoofinance.csv" % (symbol, year)
            if not os.path.exists(fileName):
                print "Downloading %s %d" % (symbol, year)
                yahoofinance.download_daily_bars(symbol, year, fileName)
            feed.addBarsFromCSV(symbol, fileName)
    return feed

def main(plot):
    instruments = ["gld", "gdx"]
    windowSize = 50

    # Download the bars.
    feed = build_feed(instruments, 2006, 2012)

    myStrategy = MyStrategy(feed, instruments[0], instruments[1], windowSize)

    if plot:
        plt = plotter.StrategyPlotter(myStrategy, False, False, True)
        plt.getOrCreateSubplot("hedge").addDataSeries("Hedge Ratio", myStrategy.getHedgeRatioDS())
        plt.getOrCreateSubplot("spread").addDataSeries("Spread", myStrategy.getSpreadDS())

    myStrategy.run()
    print "Result: %.2f" % myStrategy.getResult()

    if plot:
        plt.plot()

if __name__ == "__main__":
    main(True)
this is what the output should look like:
Downloading gld 2006
Downloading gdx 2006
Downloading gld 2007
Downloading gdx 2007
Downloading gld 2008
Downloading gdx 2008
Downloading gld 2009
Downloading gdx 2009
Downloading gld 2010
Downloading gdx 2010
Downloading gld 2011
Downloading gdx 2011
Downloading gld 2012
Downloading gdx 2012
Result: 1241843.95
and this is what the plot should look like:
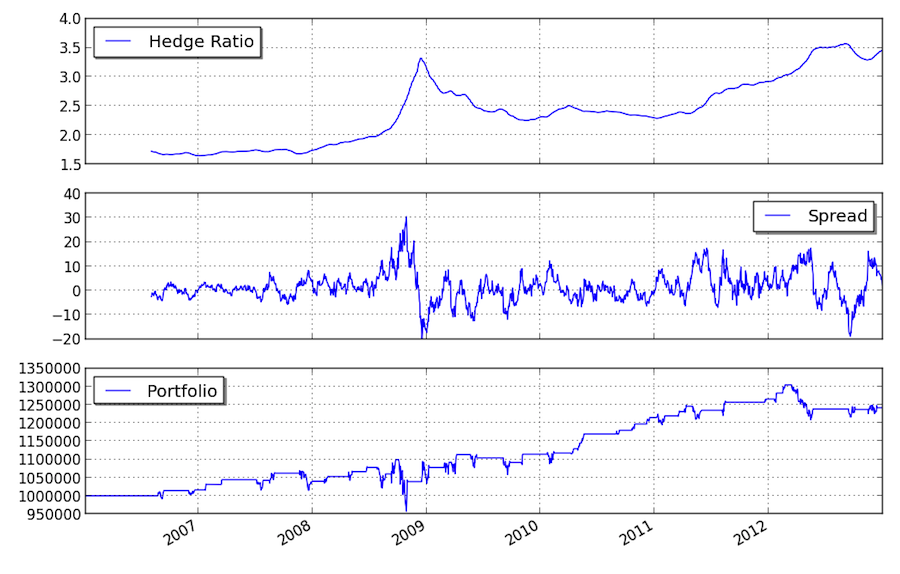
you can get better returns by tunning the window size as well as the entry and exit values for the z-score.