Event profiler
Inspired in QSTK, the eventprofiler module is a tool to analyze, statistically, how events affect future equity prices. The event profiler scans over historical data for a specified event and then calculates the impact of that event on the equity prices in the past and the future over a certain lookback period.
The goal of this tool is to help you quickly validate an idea, before moving forward with the backtesting process.
- class pyalgotrade.eventprofiler.Results(eventsDict, lookBack, lookForward)
Bases: object
Results from the profiler.
- getEventCount()
Returns the number of events occurred. Events that are on the boundary are skipped.
- class pyalgotrade.eventprofiler.Predicate
Bases: object
Base class for event identification. You should subclass this to implement the event identification logic.
- eventOccurred(instrument, bards)
Override (mandatory) to determine if an event took place in the last bar (bards[-1]).
Parameters: - instrument (string.) – Instrument identifier.
- bards (pyalgotrade.dataseries.bards.BarDataSeries.) – The BarDataSeries for the given instrument.
Return type: boolean.
- class pyalgotrade.eventprofiler.Profiler(predicate, lookBack, lookForward)
Bases: object
This class is responsible for scanning over historical data and analyzing returns before and after the events.
Parameters: - run(feed, useAdjustedCloseForReturns=True)
Runs the analysis using the bars supplied by the feed.
Parameters: - barFeed (pyalgotrade.barfeed.BarFeed.) – The bar feed to use to run the analysis.
- useAdjustedCloseForReturns (boolean.) – True if adjusted close values should be used to calculate returns.
- pyalgotrade.eventprofiler.plot(profilerResults)
Plots the result of the analysis.
Parameters: profilerResults (Results.) – The result of the analysis
Example
The following example is inspired on the ‘Buy-on-Gap Model’ from Ernie Chan’s book: ‘Algorithmic Trading: Winning Strategies and Their Rationale’:
- The idea is to select a stock near the market open whose returns from their previous day’s lows to today’s open are lower that one standard deviation. The standard deviation is computed using the daily close-to-close returns of the last 90 days. These are the stocks that “gapped down”.
- This is narrowed down by requiring the open price to be higher than the 20-day moving average of the closing price.
from __future__ import print_function

from pyalgotrade import eventprofiler
from pyalgotrade.technical import stats
from pyalgotrade.technical import roc
from pyalgotrade.technical import ma
from pyalgotrade.tools import quandl

# Event inspired on an example from Ernie Chan's book:
# 'Algorithmic Trading: Winning Strategies and Their Rationale'


class BuyOnGap(eventprofiler.Predicate):
    def __init__(self, feed):
        super(BuyOnGap, self).__init__()

        stdDevPeriod = 90
        smaPeriod = 20
        self.__returns = {}
        self.__stdDev = {}
        self.__ma = {}
        for instrument in feed.getRegisteredInstruments():
            priceDS = feed[instrument].getAdjCloseDataSeries()
            # Returns over the adjusted close values.
            self.__returns[instrument] = roc.RateOfChange(priceDS, 1)
            # StdDev over those returns.
            self.__stdDev[instrument] = stats.StdDev(self.__returns[instrument], stdDevPeriod)
            # MA over the adjusted close values.
            self.__ma[instrument] = ma.SMA(priceDS, smaPeriod)

    def __gappedDown(self, instrument, bards):
        ret = False
        if self.__stdDev[instrument][-1] is not None:
            prevBar = bards[-2]
            currBar = bards[-1]
            low2OpenRet = (currBar.getOpen(True) - prevBar.getLow(True)) / float(prevBar.getLow(True))
            if low2OpenRet < (self.__returns[instrument][-1] - self.__stdDev[instrument][-1]):
                ret = True
        return ret

    def __aboveSMA(self, instrument, bards):
        ret = False
        if self.__ma[instrument][-1] is not None and bards[-1].getOpen(True) > self.__ma[instrument][-1]:
            ret = True
        return ret

    def eventOccurred(self, instrument, bards):
        ret = False
        if self.__gappedDown(instrument, bards) and self.__aboveSMA(instrument, bards):
            ret = True
        return ret


def main(plot):
    instruments = ["IBM", "AES", "AIG"]
    feed = quandl.build_feed("WIKI", instruments, 2008, 2009, ".")

    predicate = BuyOnGap(feed)
    eventProfiler = eventprofiler.Profiler(predicate, 5, 5)
    eventProfiler.run(feed, True)

    results = eventProfiler.getResults()
    print("%d events found" % (results.getEventCount()))
    if plot:
        eventprofiler.plot(results)

if __name__ == "__main__":
    main(True)
The code is doing 4 things:
- Declaring a Predicate that implements the ‘Buy-on-Gap Model’ event identification.
- Loading bars for some stocks.
- Running the analysis.
- Plotting the results.
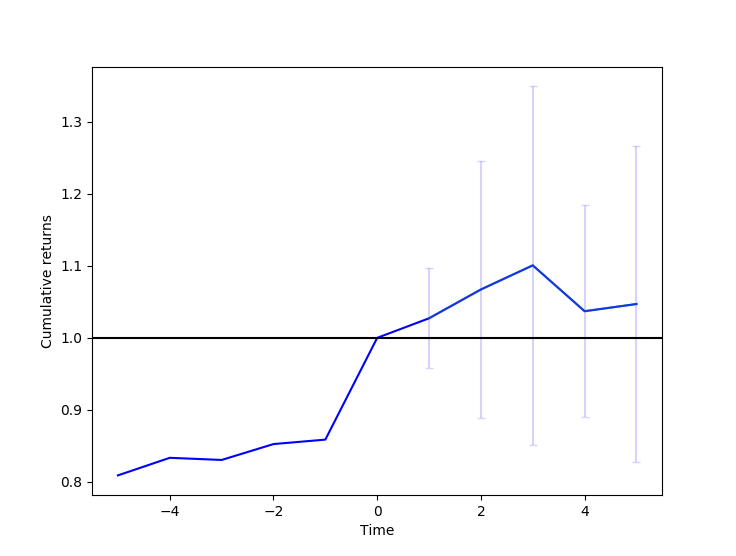
This is what the output should look like:
2017-07-22 00:26:06,574 quandl [INFO] Downloading IBM 2008 to ./WIKI-IBM-2008-quandl.csv
2017-07-22 00:26:08,299 quandl [INFO] Downloading AES 2008 to ./WIKI-AES-2008-quandl.csv
2017-07-22 00:26:09,849 quandl [INFO] Downloading AIG 2008 to ./WIKI-AIG-2008-quandl.csv
2017-07-22 00:26:11,513 quandl [INFO] Downloading IBM 2009 to ./WIKI-IBM-2009-quandl.csv
2017-07-22 00:26:13,128 quandl [INFO] Downloading AES 2009 to ./WIKI-AES-2009-quandl.csv
2017-07-22 00:26:14,626 quandl [INFO] Downloading AIG 2009 to ./WIKI-AIG-2009-quandl.csv
15 events found
Note that Cummulative returns are normalized to the time of the event.