Bollinger Bands
- This sample is based on:
from pyalgotrade import strategy
from pyalgotrade.barfeed import yahoofeed
from pyalgotrade import plotter
from pyalgotrade.tools import yahoofinance
from pyalgotrade.technical import bollinger

import os

class MyStrategy(strategy.BacktestingStrategy):
    def __init__(self, feed, instrument, bBandsPeriod):
        strategy.BacktestingStrategy.__init__(self, feed)
        self.__instrument = instrument
        self.__bbands = bollinger.BollingerBands(feed[instrument].getCloseDataSeries(), bBandsPeriod, 2)

    def getBollingerBands(self):
        return self.__bbands

    def onBars(self, bars):
        lower = self.__bbands.getLowerBand()[-1]
        upper = self.__bbands.getUpperBand()[-1]
        if lower == None:
            return

        shares = self.getBroker().getShares(self.__instrument)
        bar = bars[self.__instrument]
        if shares == 0 and bar.getClose() < lower:
            sharesToBuy = int(self.getBroker().getCash(False) / bar.getClose())
            self.order(self.__instrument, sharesToBuy)
        elif shares > 0 and bar.getClose() > upper:
            self.order(self.__instrument, -1*shares)

def main(plot):
    instrument = "yhoo"
    bBandsPeriod = 40

    # Download the bars.
    feed = yahoofinance.build_feed([instrument], 2011, 2012, ".")

    myStrategy = MyStrategy(feed, instrument, bBandsPeriod)

    if plot:
        plt = plotter.StrategyPlotter(myStrategy, True, True, True)
        plt.getInstrumentSubplot(instrument).addDataSeries("upper", myStrategy.getBollingerBands().getUpperBand())
        plt.getInstrumentSubplot(instrument).addDataSeries("middle", myStrategy.getBollingerBands().getMiddleBand())
        plt.getInstrumentSubplot(instrument).addDataSeries("lower", myStrategy.getBollingerBands().getLowerBand())

    myStrategy.run()
    print "Result: %.2f" % myStrategy.getResult()

    if plot:
        plt.plot()

if __name__ == "__main__":
    main(True)
this is what the output should look like:
2013-09-21 00:06:07,740 yahoofinance [INFO] Creating data directory
2013-09-21 00:06:07,741 yahoofinance [INFO] Downloading yhoo 2011 to data/yhoo-2011-yahoofinance.csv
2013-09-21 00:06:09,621 yahoofinance [INFO] Downloading yhoo 2012 to data/yhoo-2012-yahoofinance.csv
Result: 1395359.58
and this is what the plot should look like:
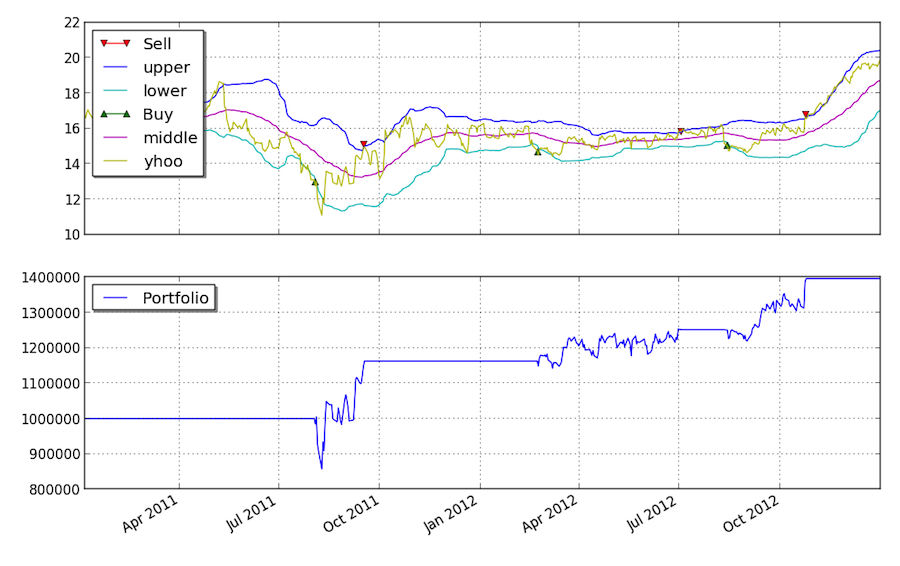
you can get better returns by tunning the Bollinger Bands period as well as the entry and exit points.